Software is playing many roles in addressing the COVID-19 pandemic. This Wired article covers a couple software projects which include applications for sharing data and an application for tracking pathogen evolution. But software is also an essential part of many of the biological research tools that are playing a major role in fighting the spread of the disease. I want to talk a little about the software basics for qPCR, which is one of the methods the CDC is using to detect and measure COVID-19 in research settings. My colleague, Keith Robison, has an excellent discussion about qPCR and COVID-19 here.
qPCR is a quantitative form of PCR which stands for polymerase chain reaction. PCR enables the detection of very small quantities of genetic material (such as a small amount of the COVID-19 virus) by amplifying it to millions or billions of copies, making detection easier. The basic idea is that the amount of DNA can be doubled through a process called thermocycling which, assuming 100% efficiency, doubles the amount of DNA during each of the 25 to 30 heating and cooling cycles of upto 6 minutes each. This in turn causes a dye to fluoresce proportionally to the number of copies made. By measuring the fluorescence at each cycle we can estimate the relative amount of material by looking at the curve. In practice the resulting reaction curve looks sigmoidal as shown below.
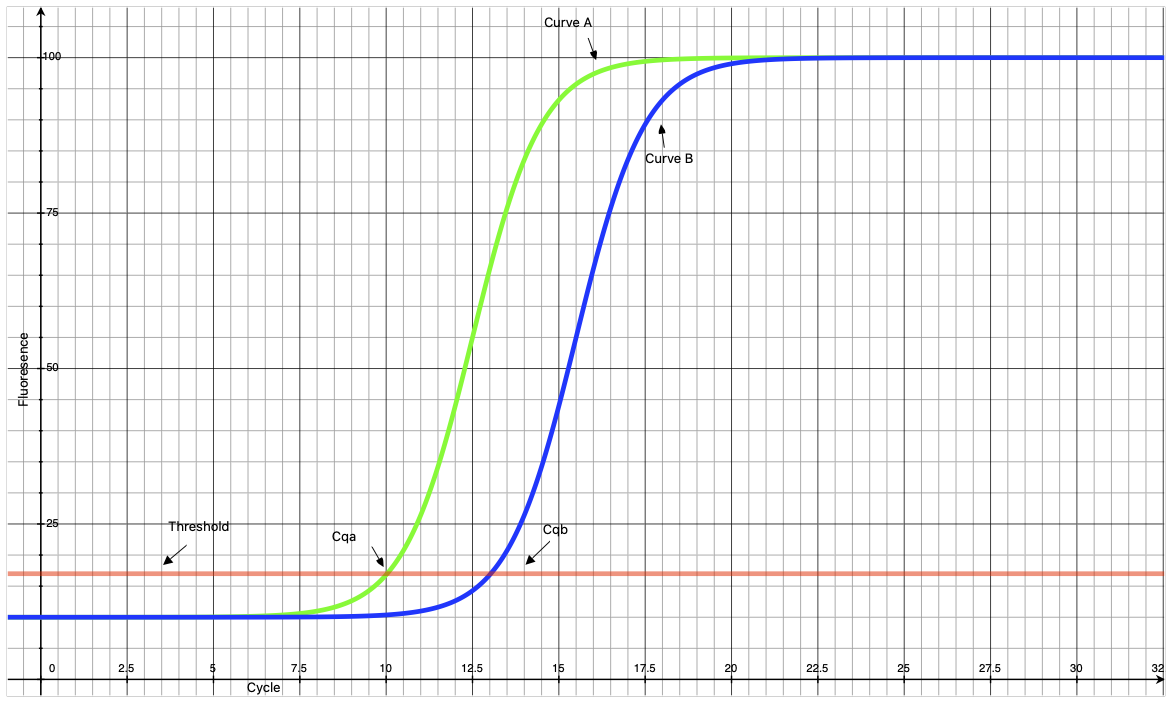
So how can we use these results to measure relative quantities of DNA? Well keep in mind that the amount of DNA doubles after each cycle. Thus, if curve A comes up 3 cycles earlier than curve B, then we would expect curve A to represent a sample with 23 or 8 times higher the concentration of genetic material than the sample represented by curve B. One simple mechanism to make this determination is to simply draw a horizontal line called the threshold and determine at which cycle curves A and B intersect with the threshold. The cycle of intersection is called the Cq or cycling quotient where smaller Cqs represent larger quantities of DNA.
So how does this help detect COVID-19? Let’s say no curve appears for a given patient sample. From this data we may conclude that COVID-19 is not present in that sample and the patient is not infected. What if a curve appears with a smaller Cq than another curve? In that case we might infer that there is 2ΔCq more genetic material in that sample and that the infection may be at a more advanced stage for that patient.
So using these kinds of algorithms, qPCR can be used to detect relative quantities of genetic material such as COVID-19. This in turn can help assess things like the state of infection in a patient or the likelihood of different transmission mechanisms. We would like to talk about what Ginkgo is offering in the world’s battle against COVID-19, so we will delve into how software contributes to those in a future post.
(Feature photo by National Cancer Institute on Unsplash)